Plot method for multiggm_fit objects
plot.multiggm_fit.RdProduces diagnostic and summary plots for a fitted multi-GGM model.
Arguments
- x
A
multiggm_fitobject returned bymultiggm_mcmc.- type
Character string specifying the plot type:
"trace_theta"Trace plots of the graph similarity parameter \(\theta_{km}\) across post-burn-in iterations. Values > 0 indicate the model is borrowing strength between groups. Requires K >= 2.
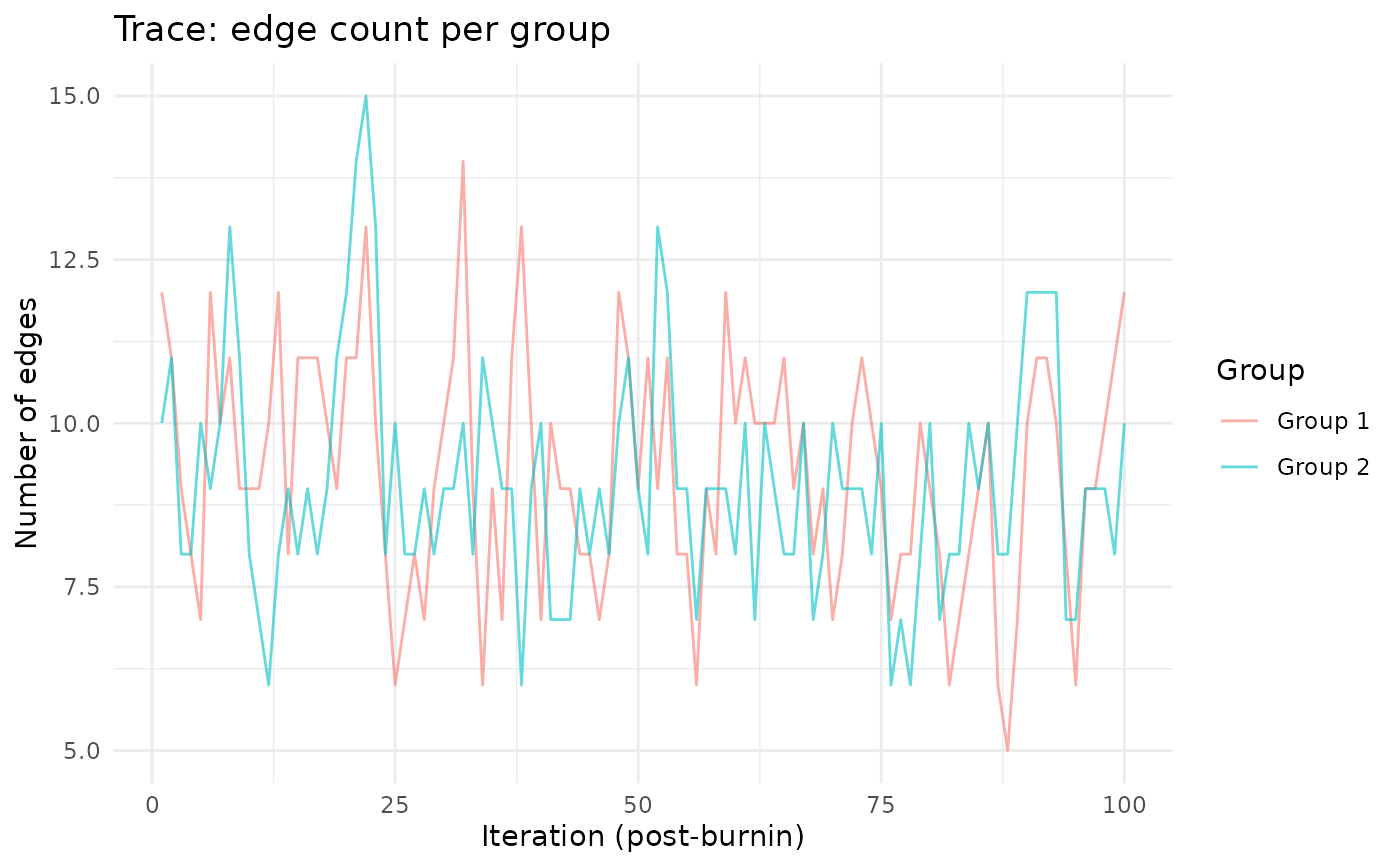
"trace_edges"Trace of the number of included edges per group across iterations. Useful for assessing convergence and stationarity of model complexity.
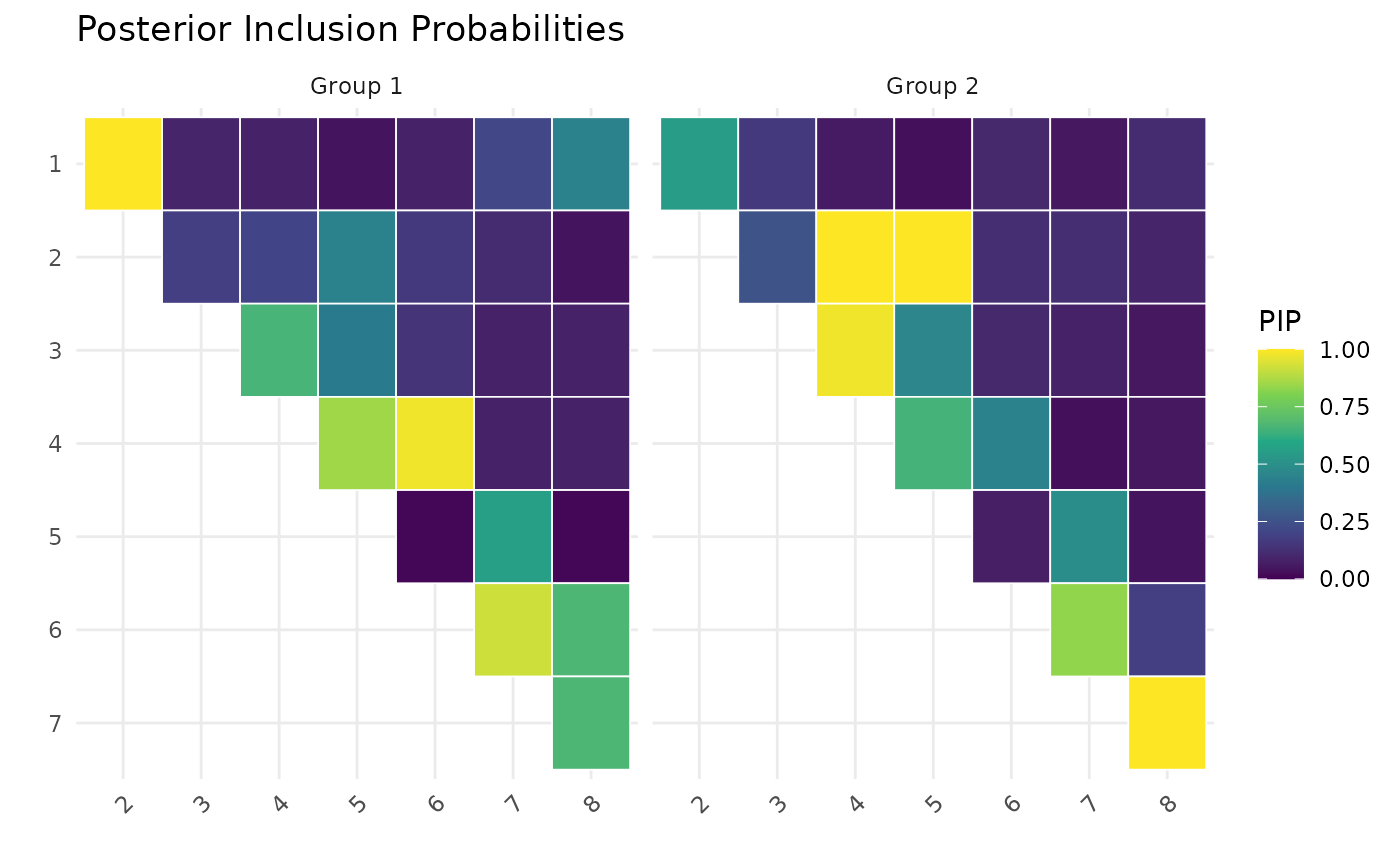
"pip"Heatmap of posterior inclusion probabilities (PIP) for each edge, faceted by group. Uses viridis color scale.
"network"Network visualization of the estimated graph at the given PIP threshold, using igraph. One plot per group.
- pip_threshold
Numeric; PIP threshold for edge selection in network plots. Default 0.5. Ignored for other plot types.
- ...
Additional arguments (currently ignored).
Value
For "trace_theta", "trace_edges", and "pip":
a ggplot object (can be further customized). For
"network": invisible NULL (plots are drawn as a side
effect using igraph).
Examples
sim <- simulate_multiggm(K = 2, p = 8, n = 80, seed = 1)
fit <- multiggm_mcmc(data_list = sim$data_list, burnin = 200, nsave = 100)
plot(fit, type = "trace_edges")

plot(fit, type = "pip")