Trace plots for MCMC diagnostics
plot_trace.RdCreates trace plots to assess MCMC convergence. Supports plotting either the graph similarity parameter (theta) or the number of edges per group across saved iterations.
Usage
plot_trace(fit, what = c("theta", "edges"))Arguments
- fit
A
multiggm_fitobject returned bymultiggm_mcmc.- what
Character; what to plot:
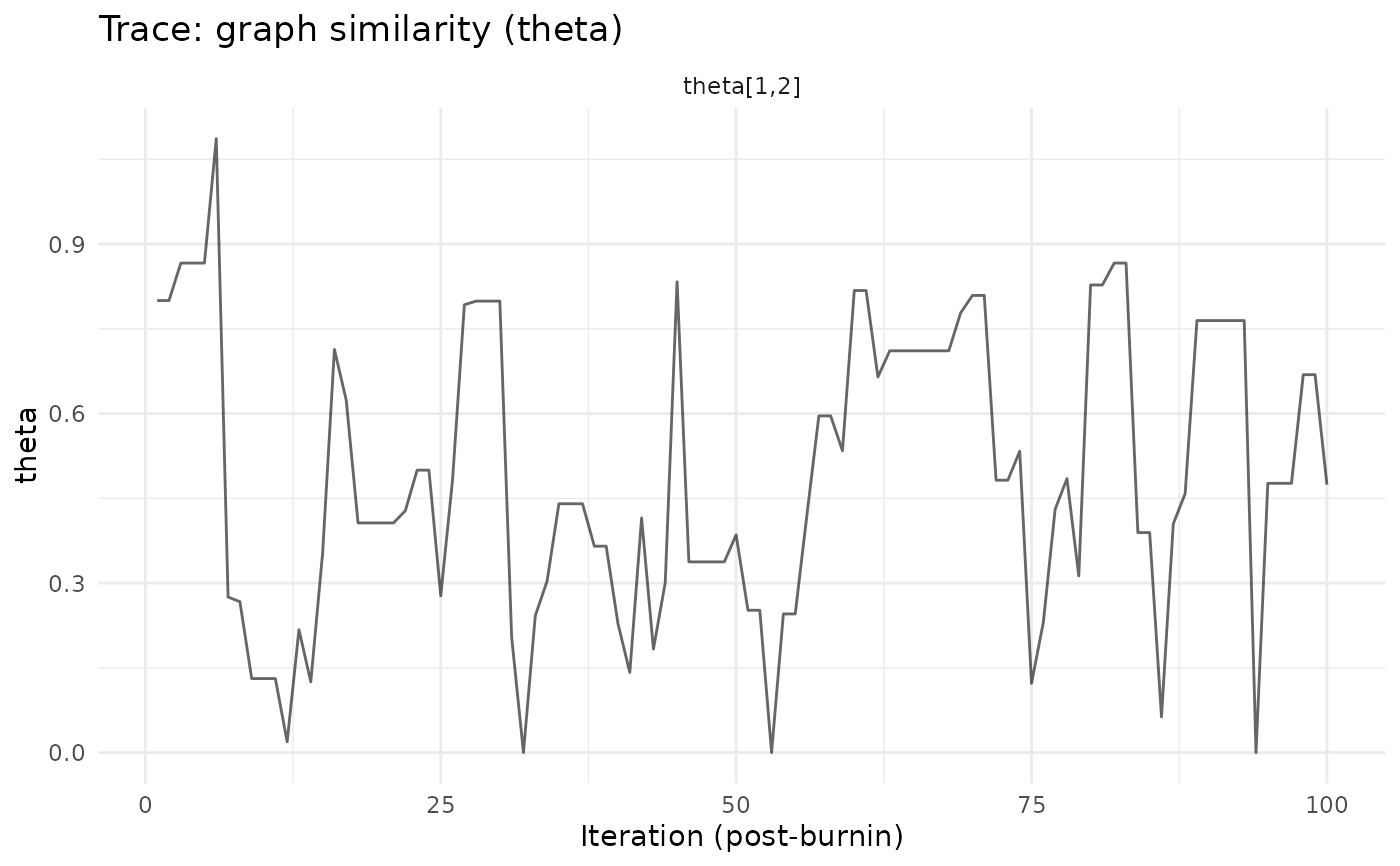
"theta"Graph similarity parameters \(\theta_{km}\) for each pair of groups. Requires K >= 2.
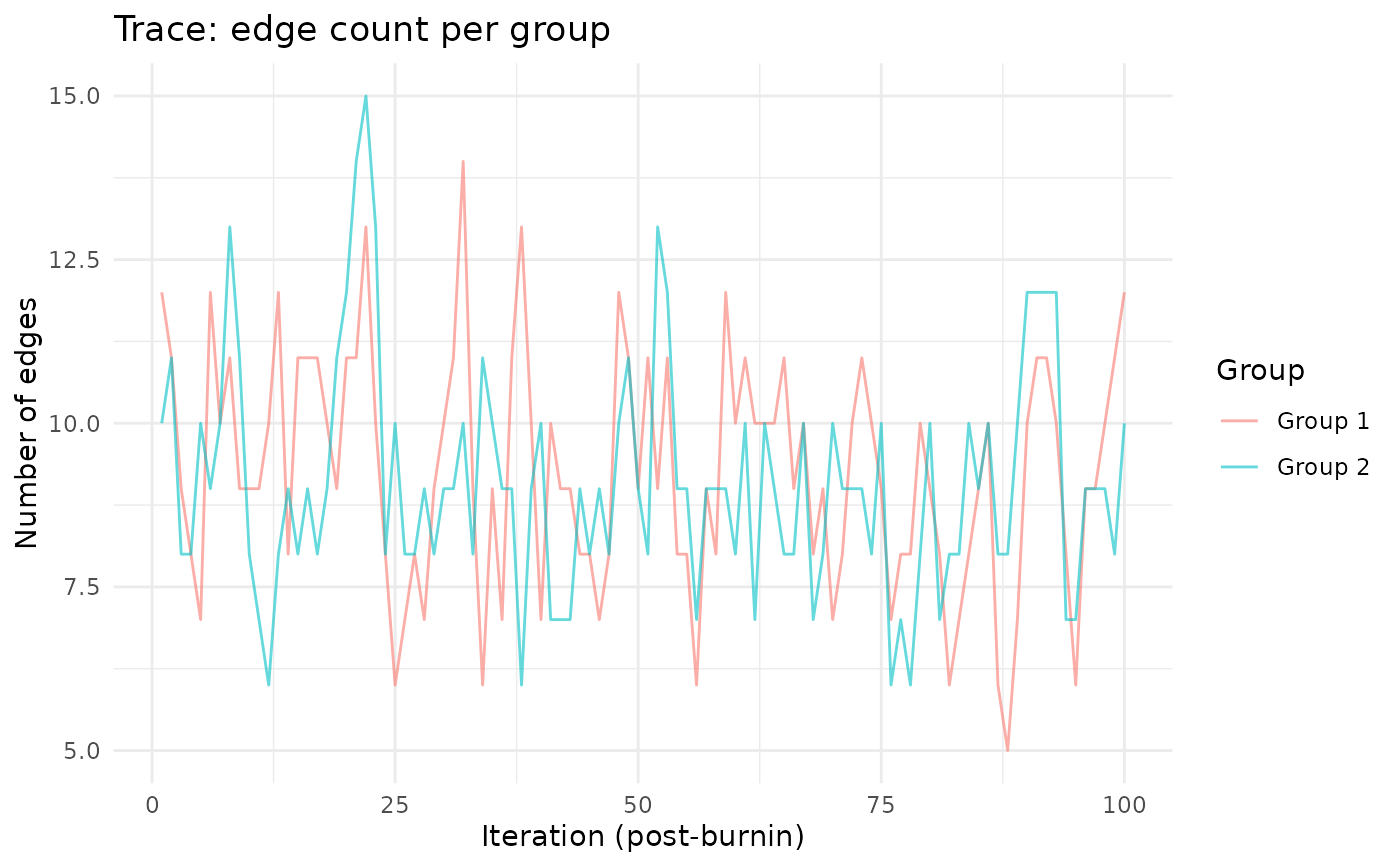
"edges"Number of edges per group at each saved iteration. Color-coded by group.
Examples
sim <- simulate_multiggm(K = 2, p = 8, n = 80, seed = 1)
fit <- multiggm_mcmc(data_list = sim$data_list, burnin = 200, nsave = 100)
plot_trace(fit, "theta")

plot_trace(fit, "edges")