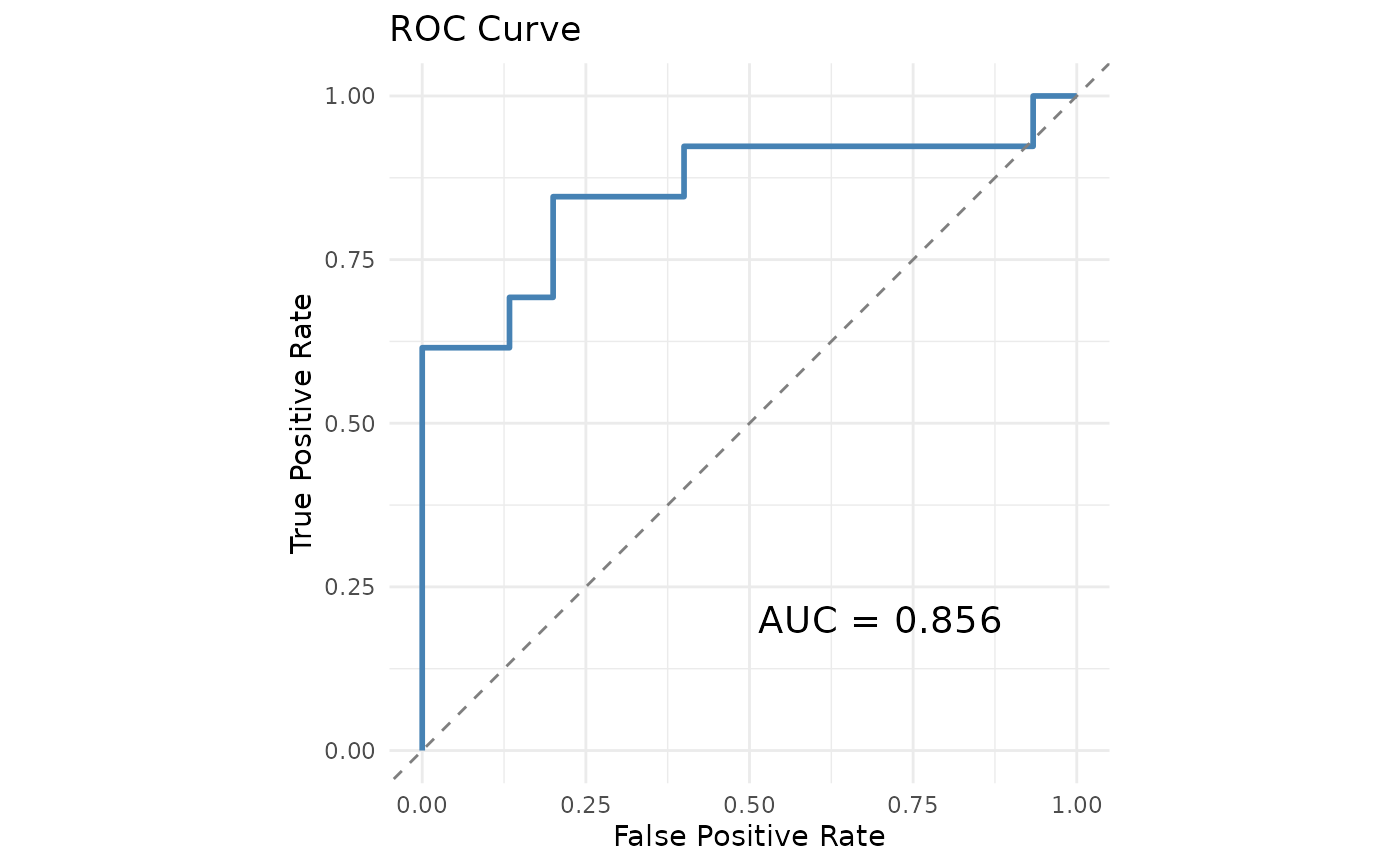
Plot ROC curve
plot_roc.RdCreates a ROC curve plot from the output of roc_auc,
with AUC annotation.
Arguments
- roc_obj
A list as returned by
roc_auc, with componentsFPR,TPR, andauc.- main
Character; plot title. Default
"ROC Curve".
Examples
sim <- simulate_multiggm(K = 2, p = 8, n = 80, seed = 1)
fit <- multiggm_mcmc(data_list = sim$data_list, burnin = 200, nsave = 100)
pip <- pip_edges(fit)
roc <- roc_auc(pip[,,1], sim$adj_list[[1]])
plot_roc(roc)