Network plot of an adjacency matrix
plot_network.RdVisualizes a graph using igraph with Fruchterman-Reingold layout.
Arguments
- adj
A symmetric adjacency matrix (0/1 or weighted). Non-zero entries are treated as edges.
- layout
An igraph layout function or a two-column matrix of node coordinates. Default: Fruchterman-Reingold (
layout_with_fr).- node_labels
Optional character vector of node names. If
NULL, nodes are labeled 1 through p.- main
Character; plot title. Default
"".- vertex_size
Numeric; node size. Default 15.
- ...
Additional arguments passed to
igraph::plot.igraph().
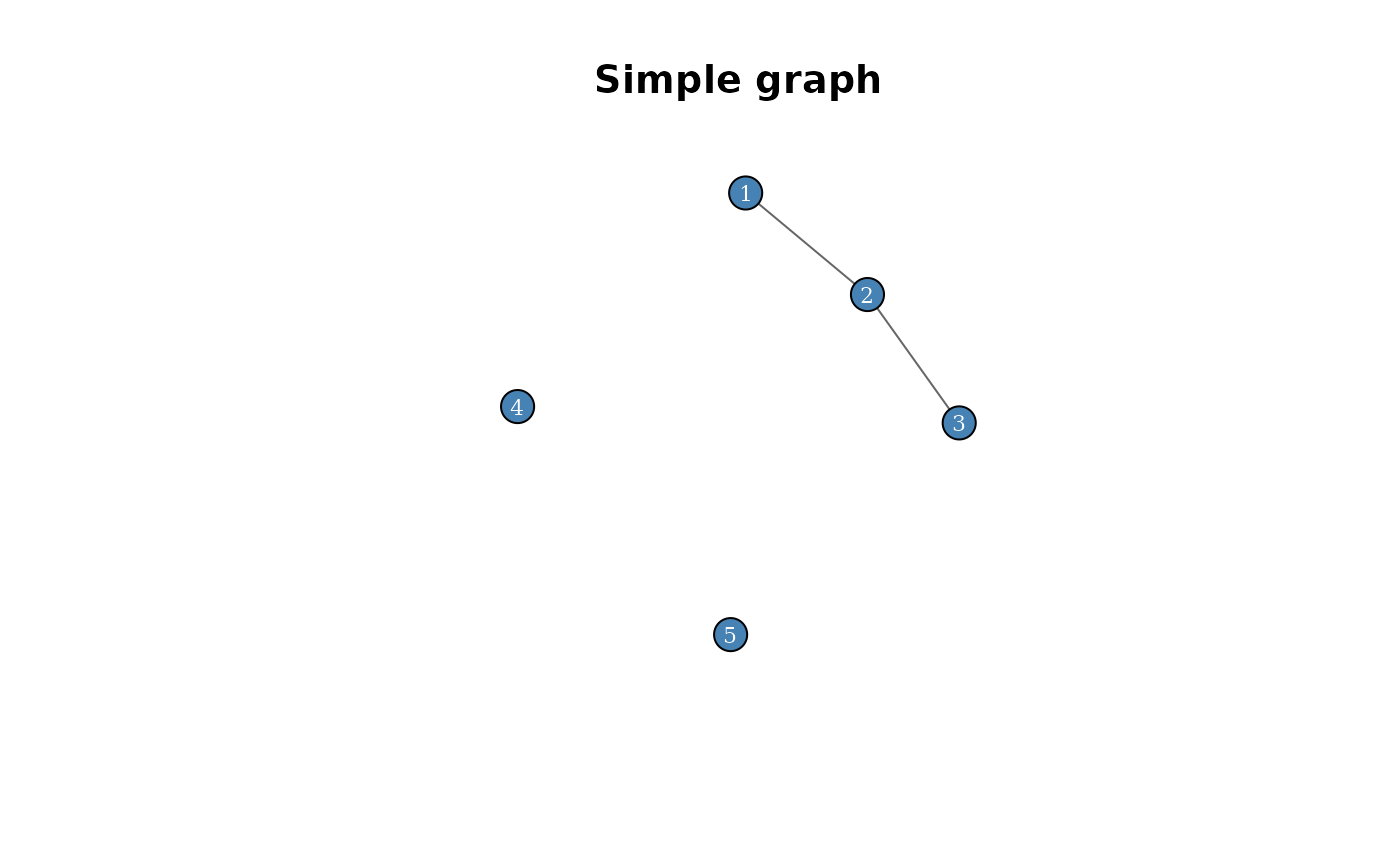
Examples
adj <- matrix(0, 5, 5)
adj[1,2] <- adj[2,1] <- adj[2,3] <- adj[3,2] <- 1
plot_network(adj, main = "Simple graph")