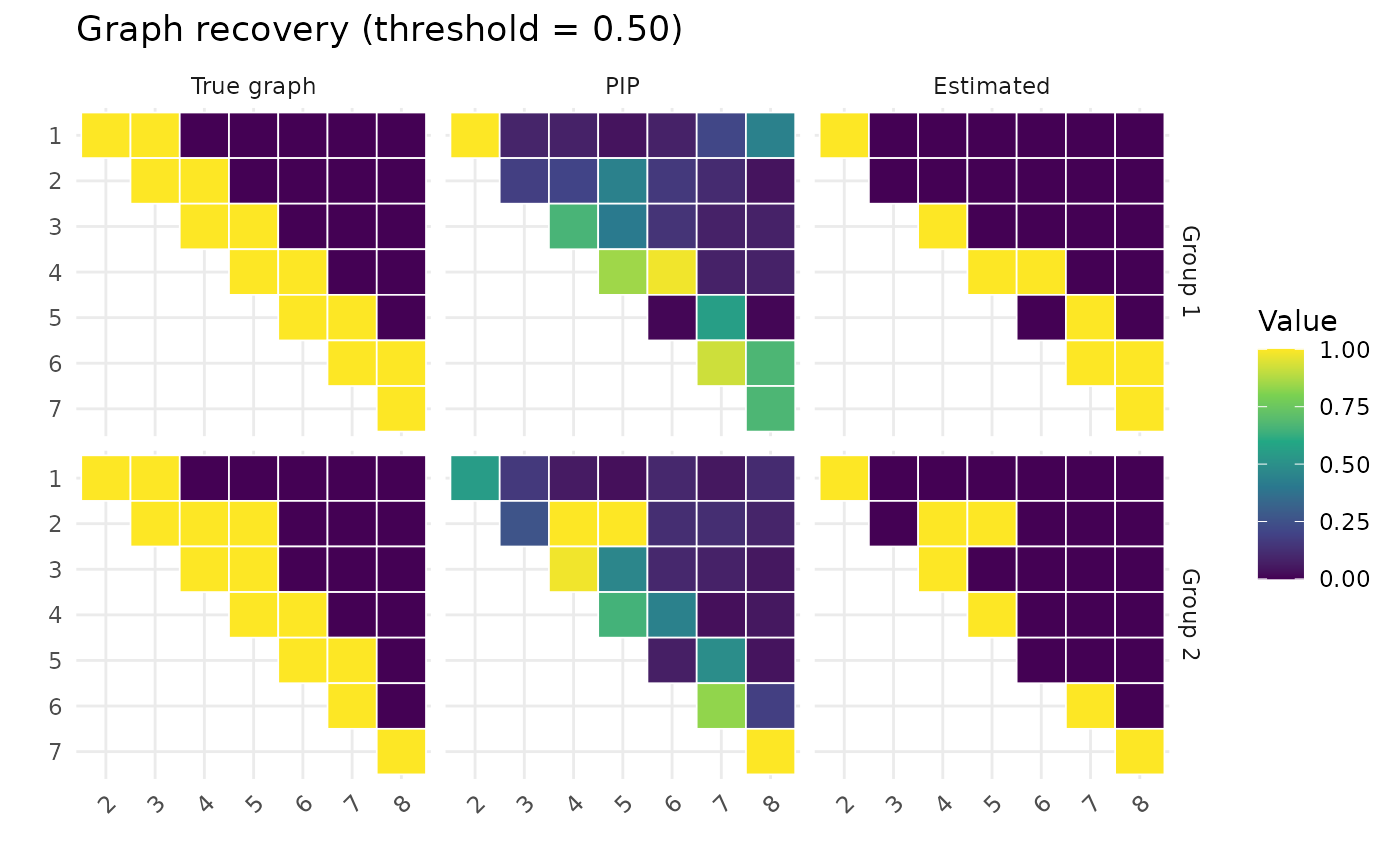
Compare estimated graph to ground truth
plot_recovery.RdShows side-by-side heatmaps of the true adjacency matrix, PIP, and thresholded estimate. Returns confusion metrics invisibly.
Arguments
- fit
A
multiggm_fitobject returned bymultiggm_mcmc.- true_adj
A list of K true adjacency matrices (0/1), or a single matrix (recycled for all groups).
- pip_threshold
Numeric; threshold for edge selection. Default 0.5.
- groups
Integer vector; which groups to plot. Default: all groups.
Value
A named list of confusion metric vectors per group (invisible).
Each element is a named numeric vector as returned by
confusion_at_threshold, with components TP,
FP, TN, FN, TPR, FPR.
Examples
sim <- simulate_multiggm(K = 2, p = 8, n = 80, seed = 1)
fit <- multiggm_mcmc(data_list = sim$data_list, burnin = 200, nsave = 100)
cm <- plot_recovery(fit, sim$adj_list)

cm$Group_1  # confusion metrics for group 1
#>         TP         FP         TN         FN        TPR        FPR
#>  8.0000000  0.0000000 15.0000000  5.0000000  0.6153846  0.0000000
cm$Group_1 # confusion metrics for group 1
#> TP FP TN FN TPR FPR
#> 8.0000000 0.0000000 15.0000000 5.0000000 0.6153846 0.0000000