Plot partial correlation heatmaps from an ssjgl fit
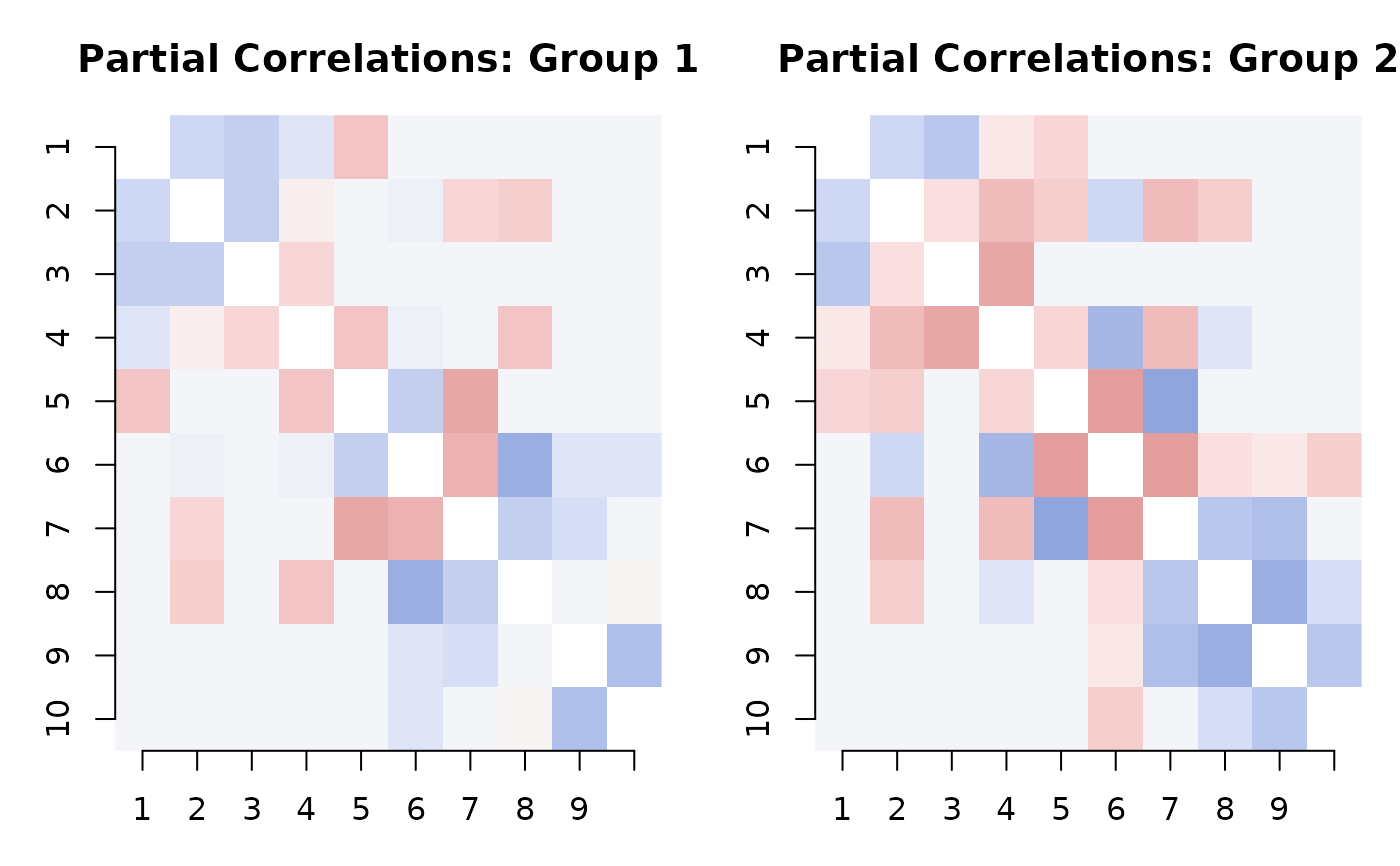
plot.ssjgl.RdProduces a side-by-side heatmap of estimated partial correlations for
each group at the specified v0 step. Edges with inclusion probability
below threshold are masked (set to zero).
Usage
# S3 method for class 'ssjgl'
plot(
  x,
  v0_index = NULL,
  threshold = 0.5,
  zlim = c(-1, 1),
  col = grDevices::hcl.colors(50, "Blue-Red 3"),
  ...
)
Arguments
- x
An object of class
ssjgl.- v0_index
Integer index into the v0 ladder. Default
NULLuses the last step.- threshold
Numeric; edges with inclusion probability below this value are masked. Default 0.5. Set to 0 to show all edges.
- zlim
Numeric vector of length 2 for the color scale. Default
c(-1, 1).- col
Color palette vector. Default uses
hcl.colors(50, "Blue-Red 3").- ...
Additional arguments passed to
image.
Examples
sim <- simulate_ssjgl_data(K = 2, p = 10, n = 50, seed = 1)
fit <- ssjgl(sim$data_list, penalty = "fused",
             lambda0 = 1, lambda1 = 0.5, lambda2 = 0.5,
             v0s = 0.01, maxitr.em = 10, impute = FALSE)
#> Ladder= 1 v0 = 0.01 done. Time: 0
plot(fit)