plot_roc.Rd
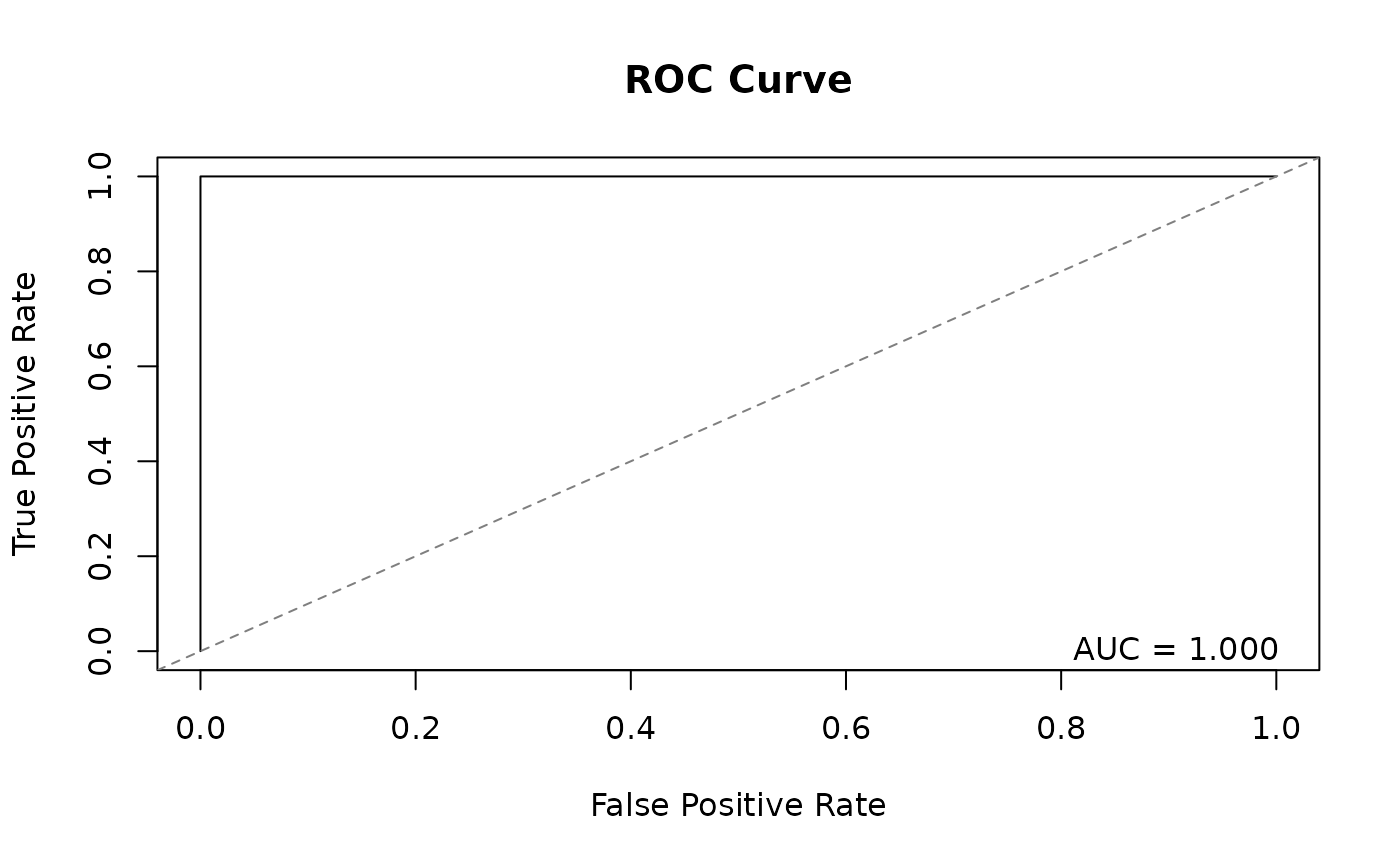
Plots the ROC curve from a roc_auc result.
roc_auc
plot_roc(roc_obj, main = "ROC Curve", ...)
A list returned by roc_auc.
Title for the plot. Default "ROC Curve".
"ROC Curve"
Additional arguments passed to plot.
plot
Invisible NULL. Called for side effect (plot).
truth <- matrix(c(0,1,0,0, 1,0,1,0, 0,1,0,1, 0,0,1,0), 4, 4)
scores <- matrix(c(0,.9,.1,.05, .9,0,.8,.1, .1,.8,0,.7, .05,.1,.7,0), 4, 4)
roc <- roc_auc(scores, truth)
plot_roc(roc)